Algorithms Overview
step1: barcode/umi extraction
Seeksoultools is able to extract the barcode and UMI sequences based on different Read1 structures. The pipeline processes the barcodes and filters Read1 and its corresponding Read2, and an updated fastq file is generated at the end of step 1.
Structure design and description
Barcode and umi descriptions: Describing the basic structure of Read1 using letters and numbers, where the letters represent the meaning of the nucleotides and the numbers represent the length of the nucleotides.
B: barcode bases L: linker bases U: umi bases X: other arbitrary bases used as placeholders
Taking the following two Read1 structures as examples: B8L8B8L10B8U8:

B17U12:

Anchor-based misalignment design: In MM design, to increase the base balance of the linker portion during sequencing,1-4 bp shifted bases, called anchors, were added. The anchor determines the starting position of the barcode.

Workflow
Anchor determination
For data with misaligned Read1 (produced by MM reagents), seeksoultools attempts to find the anchor sequence within the first 7 bases of the Read1 sequence to determine the start position of subsequent barcodes. If the anchor sequence is not found, the corresponding Read1 and R2 are considered invalid reads.
Barcode and linker correction
After determining the starting position of the barcode, the corresponding sequence is extracted based on the structural design. When the extracted barcode sequence is found in the whitelist, it is considered a valid barcode and the read count with valid barcodes is recorded. When the barcode is not found in the whitelist, it is considered an invalid barcode.
During sequencing process, there is a certain probability that sequencing error occurs. With the presense of a whitelist, seeksoultools are able to do barcode correction. When correction is enabled, if sequences that are one base differ (one humming distance apart) from the invalid barcode appear in the whitelist, we will consider the following circumstances:
If there is one and only sequence exists in the whitelist, we will correct the invalid barcode to the barcode in the whitelist.
If multiple sequences exist in the whitelist, we will correct the invalid barcode to the sequence with the highest read support.
The logic of linker correction is the same as that of barcode correction.
Adaptors and polyA sequence trimming
In transcriptome, polyA tail and Adapter sequences introduced during library preparation, may appear at the end of Read2.We remove these contaminating sequences and make sure the trimmed Read2 length is greater than the minimum length for accurate alignment afterward. If the trimmed Read2 length is less than the minimum length, we consider the read to be invalid.
After the processing procedure described above, the data composition is shown in the following figure:
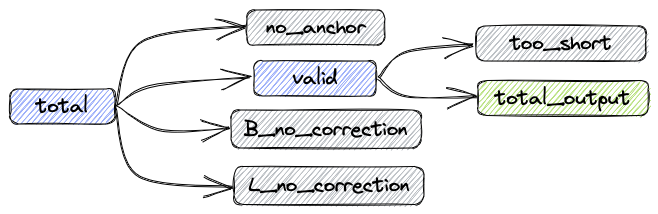
total: Total reads
valid: Number of reads without correction and number of successfully corrected reads
B_corrected: Number of successfully corrected reads
B_no_correction: Number of reads with incorrect barcodes
L_no_correction: Number of reads with incorrect linkers
no_anchor: Number of reads without anchors
trimmed: Number of reads that have been trimmed
too_short: Number of reads that are shorter than 60bps after trimming
The relationships between the metrics are as follows:
total = valid + no_anchor + B_no_correction + L_no_correction
Number of reads in the updated FASTQ file: total_output = valid - too_short
step2: Alignment
Sequence Alignment
Seeksoultools uses an aligner software called STAR to perform splicing-aware alignment of reads to the genome.
After the alignment procedure has mapped the reads to the genome, seeksoultools uses another software called qualimap along with a gene annotation transcript file GTF to bucket the reads into exonic, intronic, and intergenic regions.
Using featureCounts, the reads aligned to the genome were annotated to genes, with different rules such as strand specificity and features used for annotation. When using exon for annotation, a read is annotated to the corresponding gene if over 50% of its bases are aligned to the exon. When using transcripts for annotation, a read is annotated to the corresponding gene if over 50% of its bases are aligned to the transcript.
After the processing procedure described above, the metrics is shown below:
Reads Mapped to Genome: Fraction of reads that aligned to the genome (including both uniquely mapped reads and multi-mapped reads)
Reads Mapped Confidently to Genome: Fraction of reads that uniquely mapped to the genome
Reads Mapped to Intergenic Regions: Fraction of reads that mapped to intergenic regions
Reads Mapped to Intronic Regions: Fraction of reads that mapped to intronic regions
Reads Mapped to Exonic Regions: Fraction of reads that mapped to exonic regions
step3: Counting
UMI counting
Seeksoultools extracts group of reads that shared the same barcode from output BAM file and counts the number of UMIs annotated to genes and the number of reads corresponding to each UMI.
Filter out reads whose UMIs consist of repetitive bases. For example, TTTTTTTT.
Filter out reads that mapped to multiple genomes.
UMI correction
UMIs may also have sequencing errors during sequencing process. By default, seeksoultools uses the adjacency from UMI-tools to correct UMIs.
 Image source: https://umi-tools.readthedocs.io/en/latest/the_methods.html
Cell calling
In a cell population, we assume that the mRNA content of cells does not differ significantly. If the mRNA content of a barcode is very low, we consider that barcode might be ‘empty’, and the mRNA comes from the background. Seeksoultools uses the following steps to determine whether a barcode has a cell:
Sort all barcodes in descending order based on their corresponding UMI counts.
The threshold is calculated by dividing the number of UMIs for the barcode at the 1% position of the estimated cells by 10.
Barcodes with UMIs greater than the threshold are considered to be cells.
If the UMI of a barcode is less than the threshold but greater than 300, DropletUtils is used for further analysis. The DropletUtils method first assumes that barcodes with UMI counts below 100 are empty droplets. It then uses the total UMI count for each gene in each droplet as the expected UMI count for that gene in the background RNA expression profile. Next, it performs a statistical test on the UMI counts of each barcode, identifying those with significant differences as cells.
Those do not meet the above criteria are considered as background.
After the processing procedure described above, the metrics is shown below:
Estimated Number of Cells: Total number of cells by cell calling
Fraction Reads in Cells: Fraction of reads after cell calling among all reads used for counting
Mean Reads per Cell: Average number of reads per cell, Total number of reads/Number of cells after cell calling
Median Genes per Cell: Median gene count in barcodes after cell calling
Median UMI Counts per Cell: Median UMI count in barcodes after cell calling
Total Genes Detected: Number of genes detected in all cells
Sequencing Saturation: 1 - Total UMI count/Total read count
step4: Downstream analysis
Seeksoultools perform downstream analysis when we have gene expression matrix from step3.
Seurat analysis
Seeksoultools use Seurat to calculate the mitochondrial content, number of genes, and UMIs of each cell. After that, the gene expression matrix is normalized, and a subset of features that exhibit high cell-to-cell variation in the dataset is identified. Linear dimensional reduction using PCA is then performed, and the result is passed to t-SNE and UMAP for visualization. A graph-based clustering procedure is then followed, and cells are partitioned into different clusters. Finally, seeksoultools finds markers that define clusters via differential expression.